- Though price surged, bearish sentiment around PEPE rose as well.
- Few indicators and metrics suggested that the bull rally might end.
PEPE shocked investors recently as it went on a bull run. The price uptick in the last 24 hours allowed the memecoin to reclaim $1 billion in terms of market capitalization.
Since the degree of growth was substantial, AMBCrypto planned to have a look at PEPE’s current state to see whether the trend would last.
A look at PEPE’s bull rally
The PEPE price took off in the last 24 hours as it managed to spike by more than 50%. However, after reaching that level, the meme coin witnessed a slight price correction.
According to CoinMarketCap, PEPE’s price was up by over 31% over the last 24 hours. At the time of writing, the meme coin was trading at $0.000002661 with a market cap of over $1.12 billion, making it the 74th largest crypto.
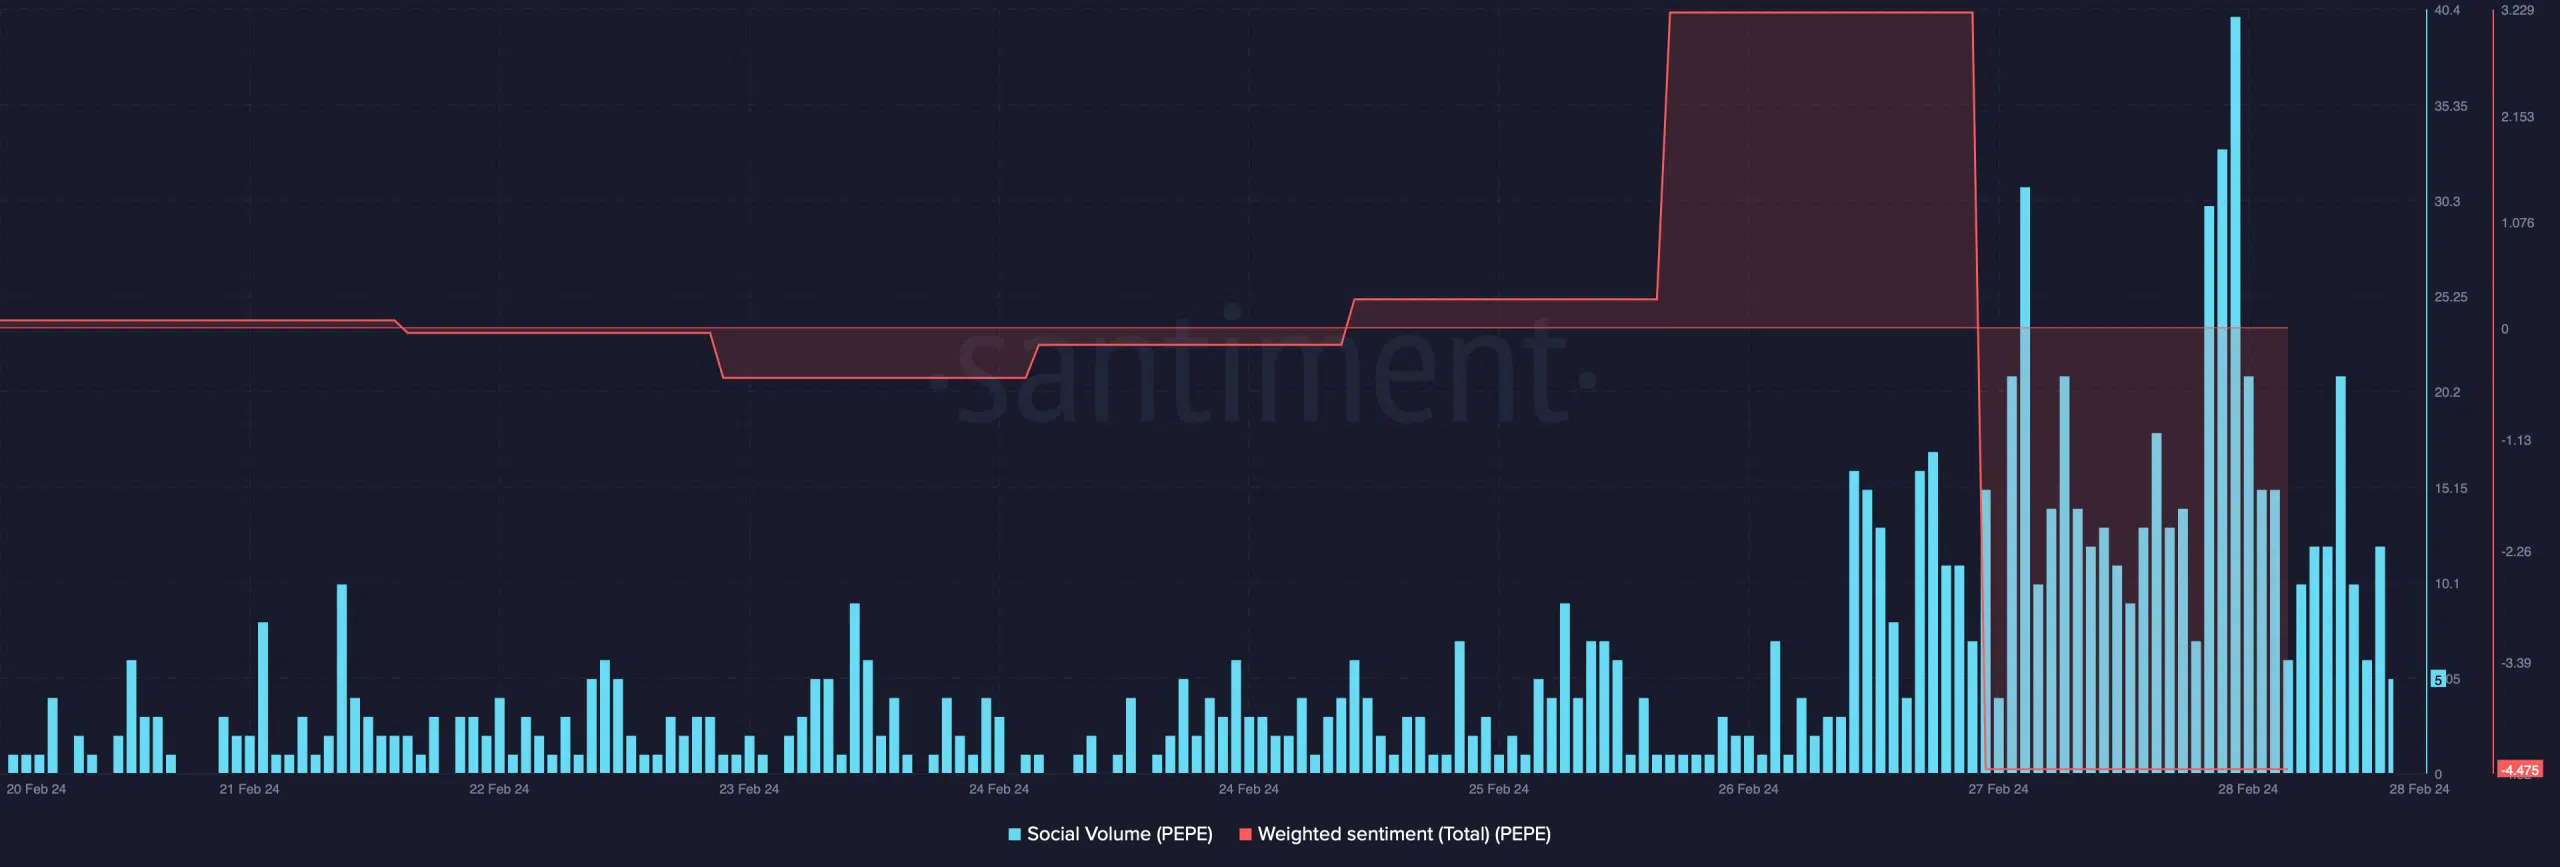
Thanks to the bull rally, the crypto community started to talk about the memecoin, which was evident from the rise in its social volume.
However, it was surprising to see that, despite the price uptrend, bearish sentiment around the coin increased as its weighted sentiment dropped sharply on the 27th of February.
PEPE’s uptrend might end soon
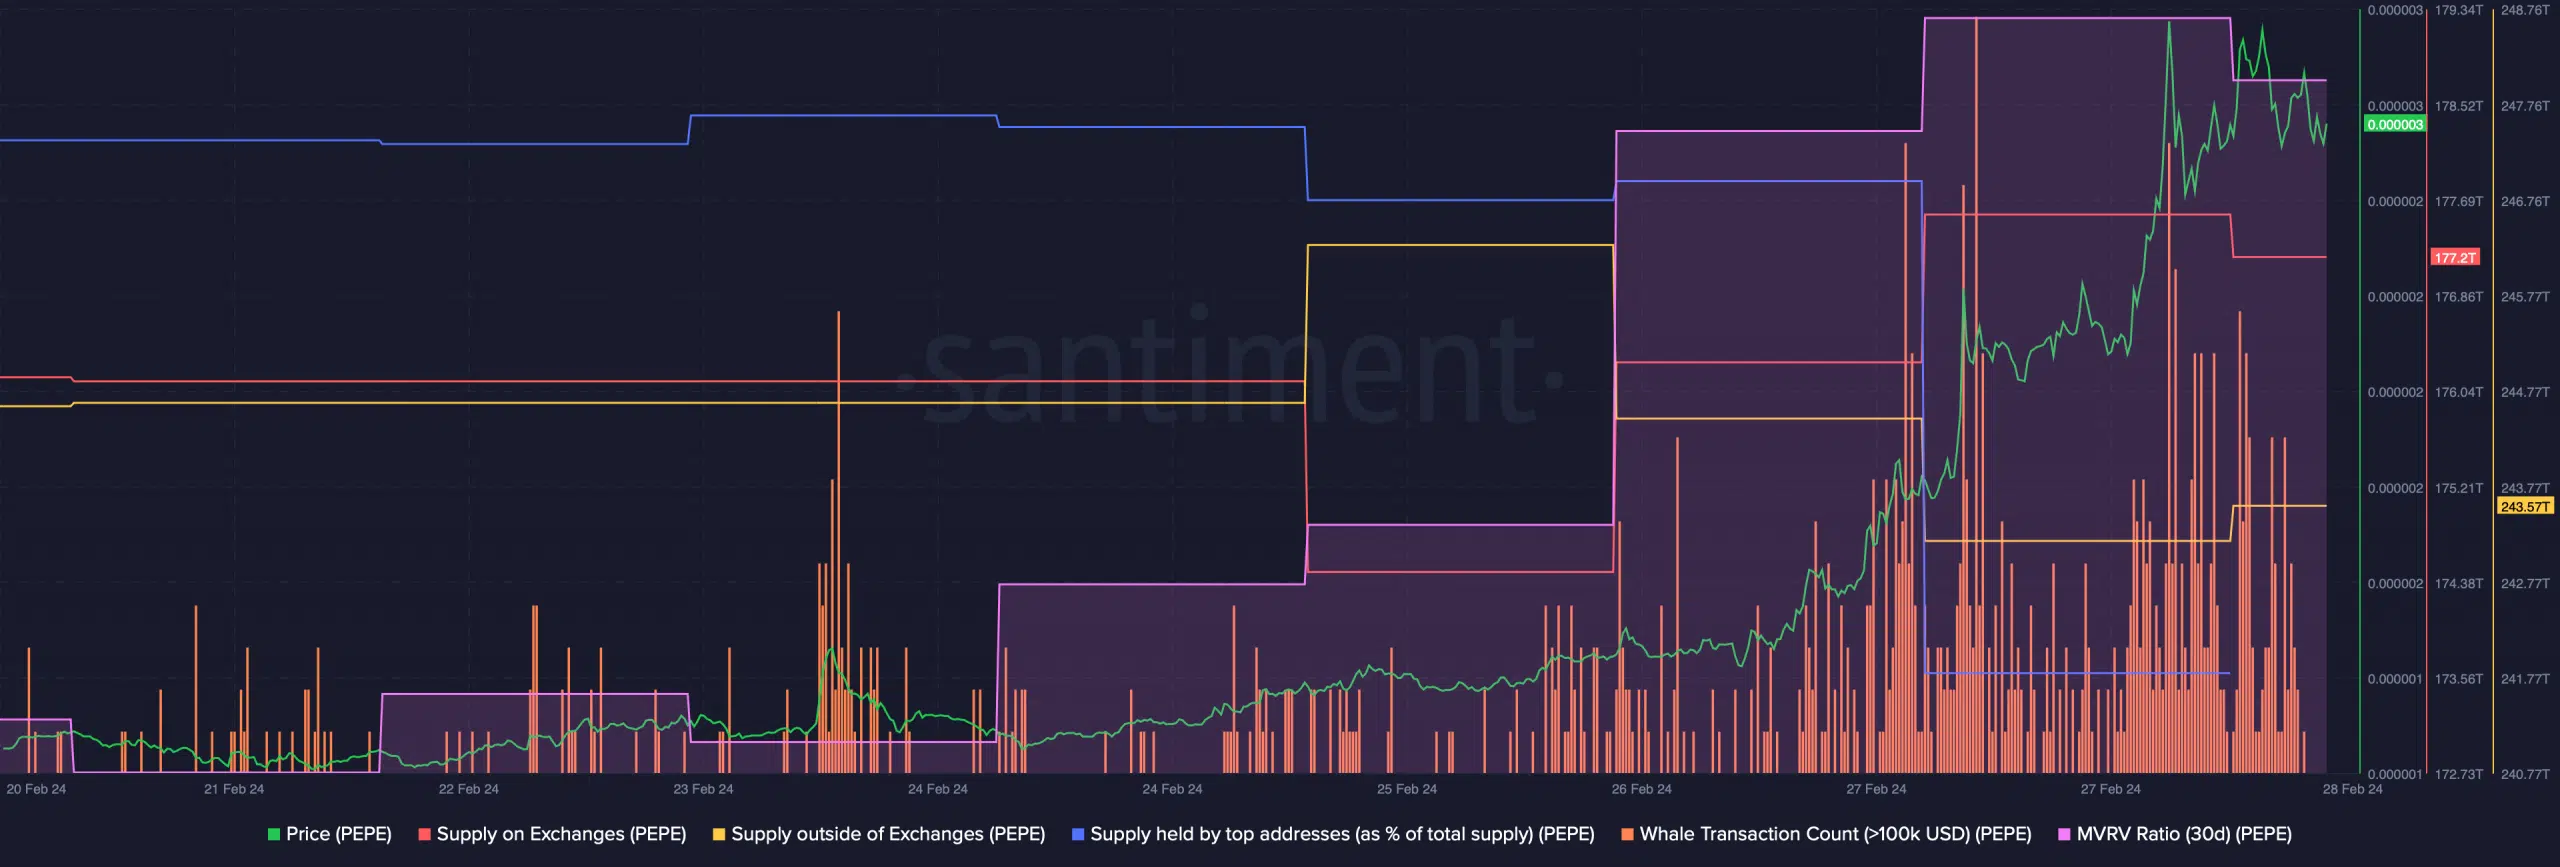
Apart from weighted sentiment, quite a few other metrics also looked pretty bearish on the meme coin. For example, while the coin’s price surged, investors started to sell their holdings.
The memecoin’s supply on exchanges increased while its supply outside of exchanges dropped, signifying high selling pressure.
Whale activity around the coin remained high as its whale transaction count increased. But whales were also actively selling their holdings as the supply held by top addresses dropped.
The hike in selling pressure might put an end to PEPE’s bull rally in the coming days. Additionally, the coin’s MVRV ratio was over 50% at press time; such a high MVRV ratio often indicates a possible price correction.
Read PEPE’s Price Prediction 2024-25
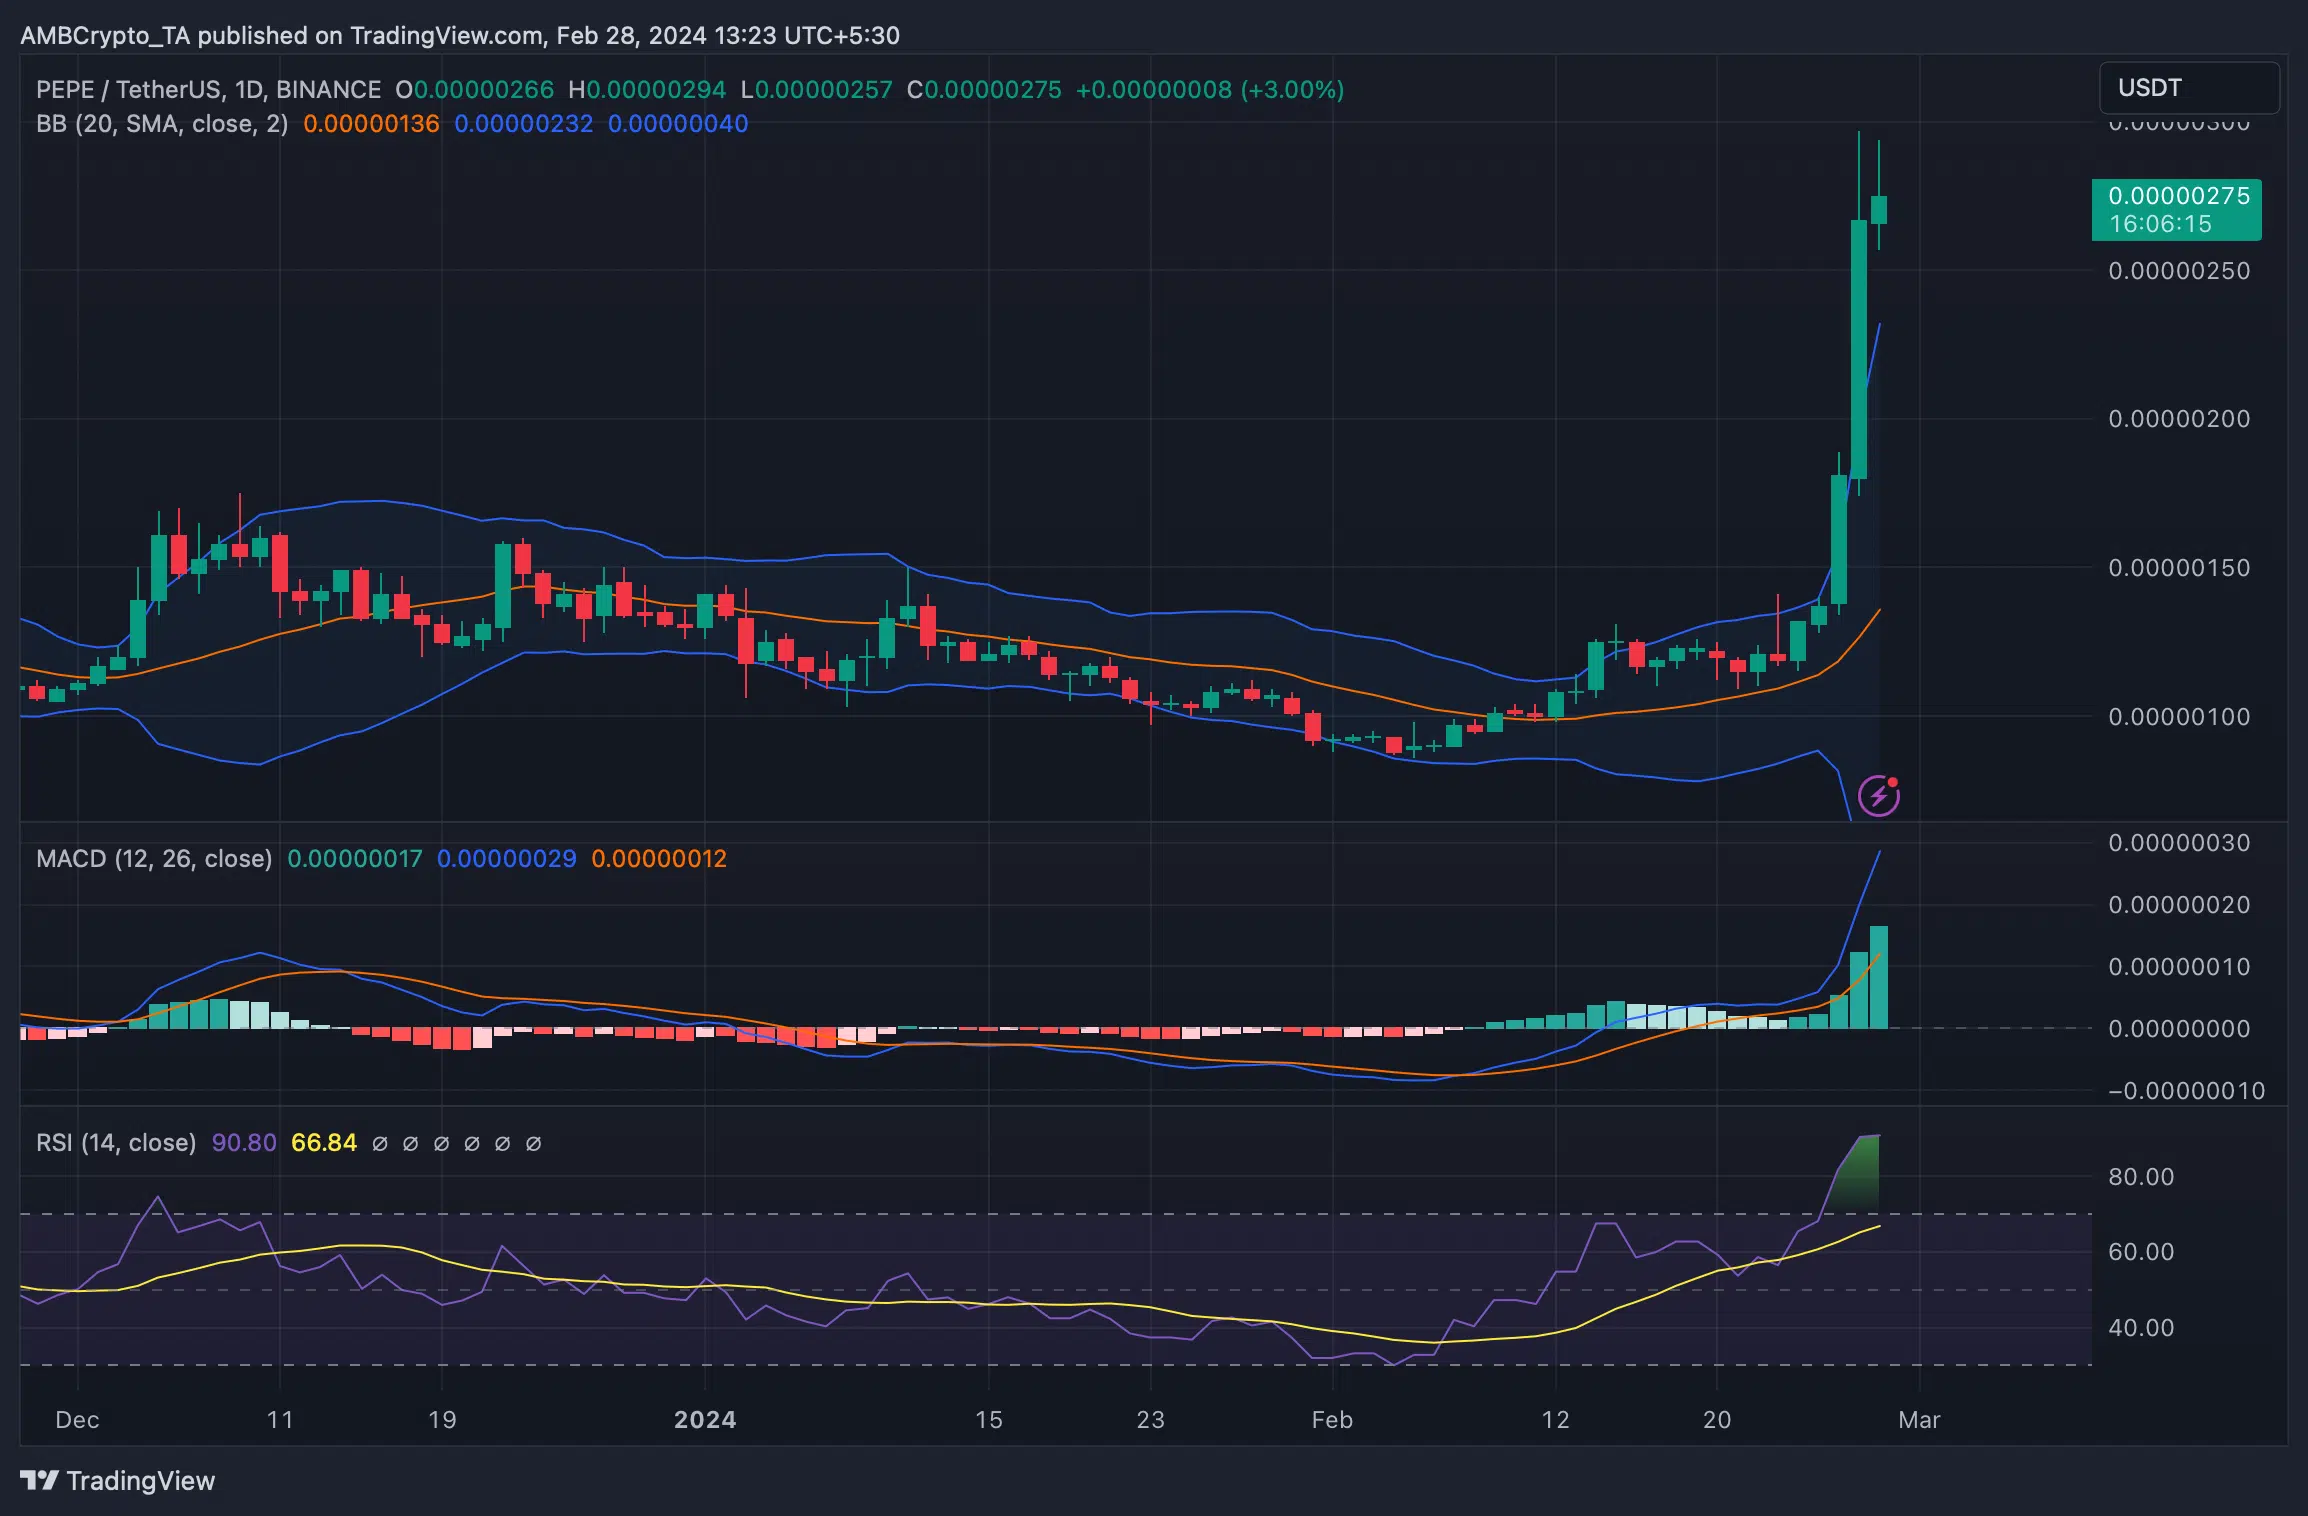
To double check whether a downtrend is around the corner, AMBCryto took a look at the meme coin’s daily chart. We found that the memecoin’s price touched the upper limit of the Bollinger bands.
Its Relative Strength Index (RSI) was also in the overbought zone. These two indicators hinted at a possible increase in selling pressure, which might push PEPE’s price down.
Nonetheless, the MACD provided some hope as it displayed a clear bullish upper hand in the market.


