Coinbase Prime, the crypto platform explicitly designed for institutional investors, trusts, and high-net-worth individuals, has seen a dramatic increase in trading activity following the U.S. spot Bitcoin ETFs launch.
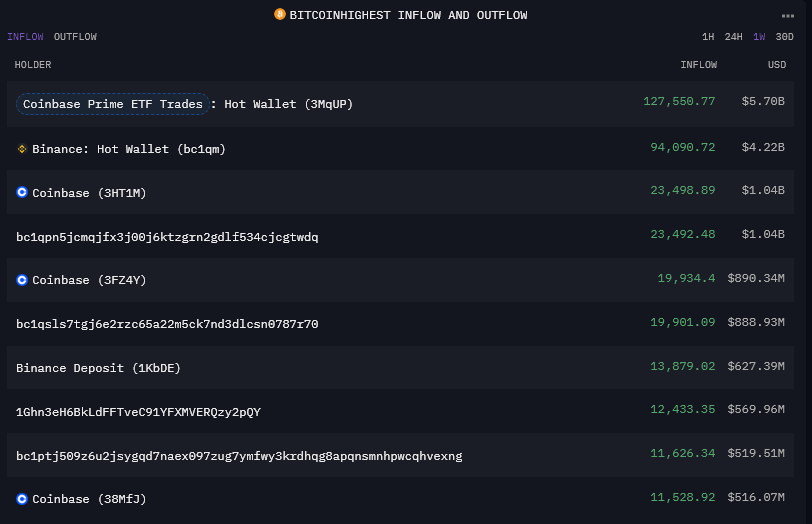
CryptoSlate analysis identified a hot wallet at Coinbase Prime that has surged to the top of the Bitcoin inflow chart over the past week. This wallet, used for trading activities within the platform, saw modest inflows and outflows in the hundreds of millions over the course of a month throughout 2023. However, over the past week, it has seen $5.7 billion in inflows and an equivalent amount of outflows. Historically, Binance’s hot wallet has dominated the flow leaderboard, and from the data analyzed, this appears to be the first time Coinbase Prime has surpassed Binance over 7 days.

Over the past 30 days, Binance still leads with around $14 billion in inflows and outflows, while Coinbase Prime flags slightly behind at around $12 billion. It is worth noting that other trading wallets are tagged as belonging to Coinbase Prime on Arkham Intelligence. However, this wallet appears to handle large transactions.
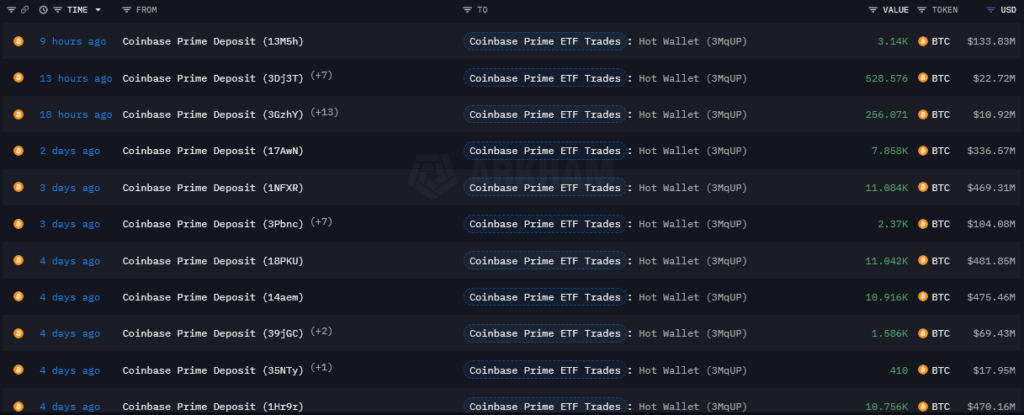
The surge in activity can be seen through the table below, which shows only transactions greater than $10 million. In the past 4 days alone, there were several deposits of over $400 million in a single transaction.

The below visualization shows the flow of transactions over $50 million for the Coinbase Prime hot wallet. The left cluster is tagged as Coinbase Prime deposit addresses, and all only flow into the wallet. The cluster to the right contains wallets also tagged as Coinbase Prime deposit addresses but show inflows and outflows. The wallets in the bottom cluster are untagged and show only outflows from the hot wallet. The top outlier is the Coinbase exchange, which shows a single $78 million outflow.

Speculatively, the left cluster may show deposit addresses for institutions, the right wallets may be the trading wallets, and the bottom wallets could be cold storage. At present, none of this is verifiable, but it would potentially align with the data stated in the ETF prospectuses regarding how Bitcoin trading works for the funds. Remember, the above only shows transactions greater than $50 million, or around 1,100 BTC.
The below diagram includes transactions as low as $1,000 with all the above wallets locked into position. Notably, the bottom cluster still shows no inflows, while dozens of new wallets have entered the arena at these lower values.

Attempting to identify and analyze wallets related to ETF activity may give important insights into the Bitcoin market should trading volumes continue to follow the launch data. With CoinShares reporting around $17.5 billion in trading volume among crypto financial products last week, this activity will impact the spot Bitcoin price differently.
The price at which the ETFs value Bitcoin daily is calculated through the CF Benchmarks Index, BRR, which stands for the Bitcoin Reference Rate. This rate is calculated between 3 pm and 4 pm GMT on a daily basis by analyzing a range of transactions across several exchanges. The BRR is then used to calculate the net asset value for the funds and, thus, the value of the Bitcoin it holds. This rate and the fact that share creations and redemptions happen outside of standard trading hours add a new dynamic to Bitcoin trading that has not been a factor until now.

